10.10 — Serialization & Developer Tool Instrumentation
The rendering pipeline is not a one‑way street. As developers, we constantly read and write the DOM at runtime using serialization interfaces. This section explores innerHTML, outerHTML, and insertAdjacentHTML – their mechanics, performance costs, and security risks – and then dives into the developer tools that let you inspect the live DOM, the accessibility tree, and the engine's own diagnostic console.
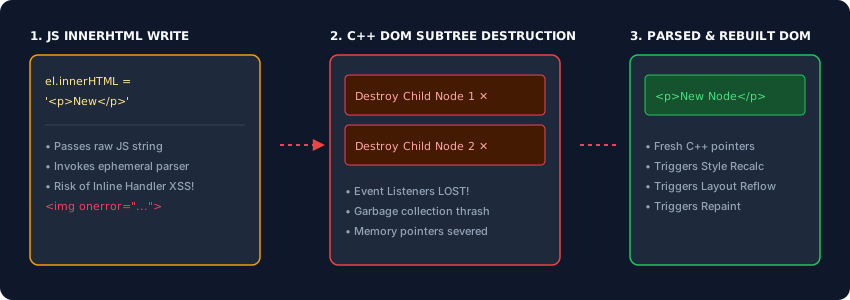
innerHTML – The Double‑Edged Sword
Reading innerHTML causes the engine to traverse the live DOM subtree and serialize it back into a string. Writing innerHTML is far more destructive: the engine destroys every existing child node in the target element, then invokes an ephemeral HTML parser to convert your string into new C++ nodes. This triggers a complete subtree replacement, followed by style recalculation and layout reflow.
This mass destruction has severe consequences:
- Performance: Even appending a single line of text forces the engine to wipe and rebuild potentially thousands of nodes.
- Event listener loss: All JavaScript event listeners attached to the destroyed nodes are permanently broken.
- Security (XSS): The parser treats the string as HTML. While
<script>tags are neutered duringinnerHTMLinjection, attackers bypass this with inline event handlers like<img src=x onerror="attack()">. The moment the broken image fails to load, the inline script executes.
Never feed untrusted user input directly into innerHTML. This is the most common vector for cross‑site scripting (XSS) attacks.
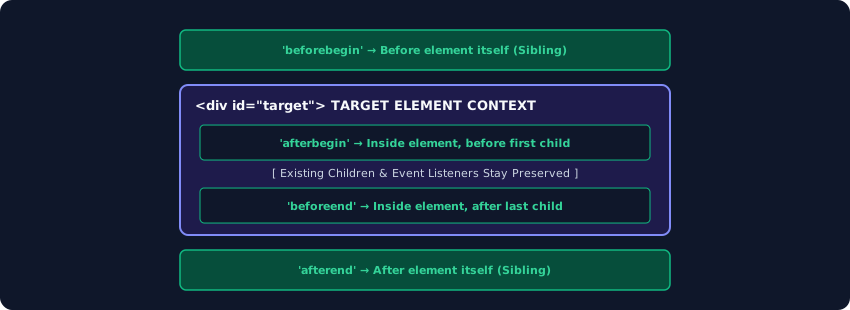
insertAdjacentHTML injects new content without destroying existing nodes.outerHTML and insertAdjacentHTML – Surgical Instruments
outerHTML works like innerHTML but replaces the target element itself. It also triggers a parse and rebuild.
The real surgical tool is insertAdjacentHTML(position, string). It accepts a position directive (beforebegin, afterbegin, beforeend, afterend) and injects the parsed nodes at exactly that location without destroying the target’s existing children. Existing event listeners and node references are preserved, making it far more efficient.
element.insertAdjacentHTML('beforeend', '<span>New content</span>');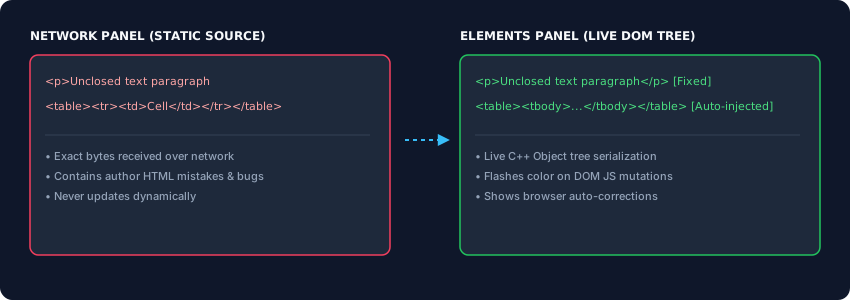
Developer Tool Instrumentation – The Elements Panel
The Elements panel is not a code viewer – it is a live serialisation of the C++ DOM tree. It reflects every runtime change: nodes added by JavaScript, attributes modified by user interaction, and structural corrections made by the parser’s error recovery. Flashing purple or yellow highlights indicate real‑time mutations.
By comparing the Elements panel with the Network panel’s raw source, you can immediately see how the browser’s fault‑tolerance algorithms have repaired broken markup, inserted missing tags, or reorganised mis‑nested elements.
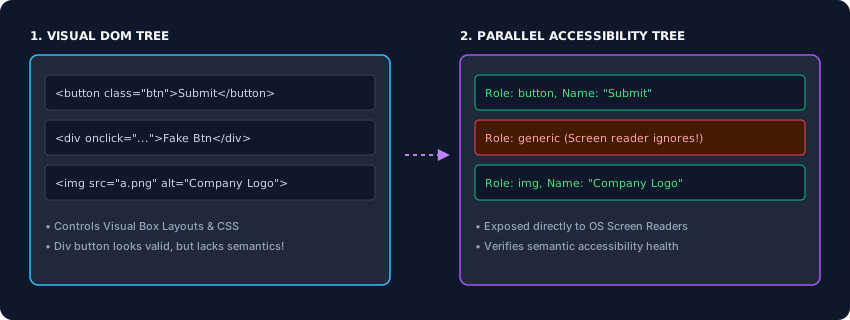
The Accessibility Tree – Your Application’s Semantic Twin
Alongside the primary DOM, the browser builds a parallel accessibility tree. This tree maps every element to an accessible role, name, and state, which is then exposed to the operating system’s screen reader. The developer tools’ Accessibility panel lets you inspect this tree directly.
For example, a <div> styled to look like a button may appear perfect visually, but the accessibility tree will label it as “generic text container” with no button role. A screen reader user will never know it’s interactive. Always verify that your semantic intentions are reflected in the accessibility tree.
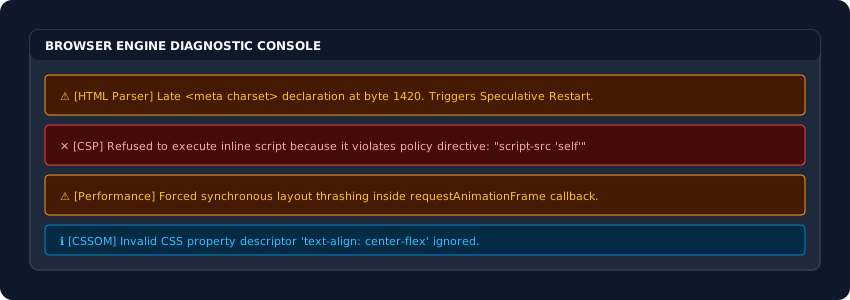
The Console Panel – The Engine’s Diagnostic Channel
The Console is more than a log; it’s the primary output for the browser engine’s own internal diagnostics. It reports:
- HTML parsing warnings (e.g., late charset declaration).
- CSS property errors and invalid selectors.
- Content Security Policy (CSP) violations, with exact details of the blocked resource.
- Cross‑origin resource blocking and network failures.
- Synchronous script execution timeouts that freeze the main thread.
These messages are not optional – they are the engine telling you exactly where your application’s critical rendering path is breaking. Always monitor the Console during development.
Serialization interfaces let you manipulate the live DOM from JavaScript, but they come with heavy costs. Avoid innerHTML for repeated updates – use insertAdjacentHTML or direct DOM methods. Never inject untrusted strings. Use the Elements panel to see the corrected live DOM, the Accessibility panel to verify semantic health, and the Console to catch engine‑level errors. Mastering these tools transforms you from a coder into a true web engineer.