6.5 — Inline Graphics: SVG, MathML & Canvas
Not every graphic needs to be a separate file. HTML lets you embed vector shapes, mathematical equations, and even drawable pixel surfaces directly in the document. This inline approach eliminates extra network requests, makes content instantly visible, and places every element into the DOM as a live, accessible node.
Mathematical Markup Language (MathML)
MathML turns equations into semantic trees. The root element <math> switches the parser into math mode. Inside, you use:
<mrow>– groups horizontal expressions.<mi>– identifiers (variables like x, y).<mn>– numbers.<mo>– operators (+,=, brackets).
To build fractions, square roots, and superscripts you use:
<mfrac>– fraction (numerator first, denominator second).<msqrt>– square root (wraps the radicand).<msup>– superscript (base, then exponent).
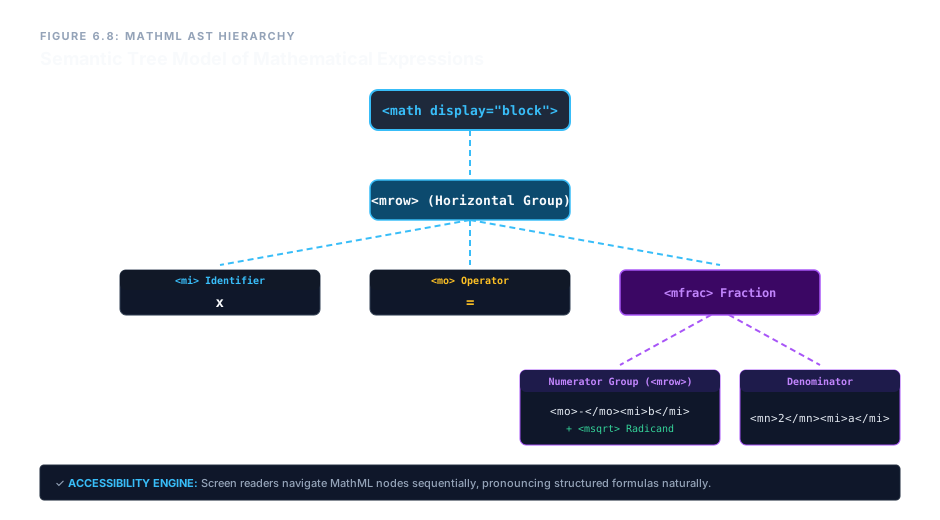
Live Example: Quadratic Formula
<math display="block">
  <mrow>
    <mi>x</mi>
    <mo>=</mo>
    <mfrac>
      <mrow>
        <mo>-</mo><mi>b</mi>
        <mo>±</mo>
        <msqrt>
          <msup><mi>b</mi><mn>2</mn></msup>
          <mo>-</mo>
          <mn>4</mn><mi>a</mi><mi>c</mi>
        </msqrt>
      </mrow>
      <mrow>
        <mn>2</mn><mi>a</mi>
      </mrow>
    </mfrac>
  </mrow>
</math>MathML renders natively in modern browsers, preserving typographic quality.
Screen readers can announce the equation step‑by‑step: “x equals the fraction with numerator negative b plus or minus the square root of b squared minus 4 a c, denominator 2 a”.
Inline Scalable Vector Graphics (SVG)
Instead of loading a .svg file via <img>, you can place the <svg> element directly in the HTML. Every shape inside becomes a DOM node that can be styled, animated, and made interactive.
The viewBox attribute defines the internal coordinate system: viewBox="min-x min-y width height". Without it, the SVG may scale unpredictably.
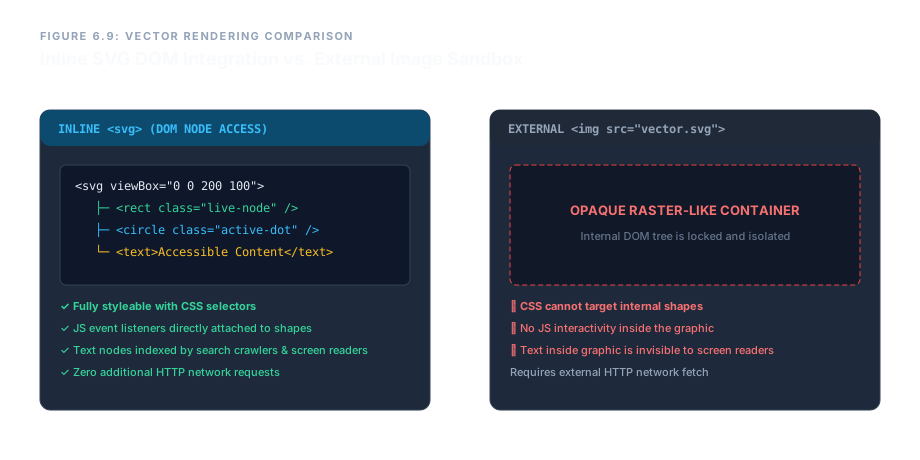
<img>.Live Example: Simple Shapes
<svg viewBox="0 0 200 100" width="200" height="100">
  <rect x="10" y="10" width="60" height="80" fill="#a78bfa" />
  <circle cx="130" cy="50" r="35" fill="#4ea8de" />
  <text x="40" y="95" font-size="12" fill="white">SVG is live</text>
</svg>The text inside the SVG is real text – searchable and accessible.
Every shape can have event listeners and ARIA attributes, making inline SVG one of the most powerful accessible graphics tools.
The <canvas> Element
<canvas> provides a blank pixel grid that you draw on with JavaScript (2D or WebGL). It is not a container of DOM nodes – it’s a low‑level bitmap surface.
Two critical rules:
- Always set
widthandheightdirectly on the element. They define the actual pixel buffer size. CSS sizing only stretches the existing buffer, causing blurriness. - Because canvases are invisible to screen readers, you must include fallback content between the opening and closing tags. This content is displayed only if the browser doesn’t support canvas or scripting is disabled.
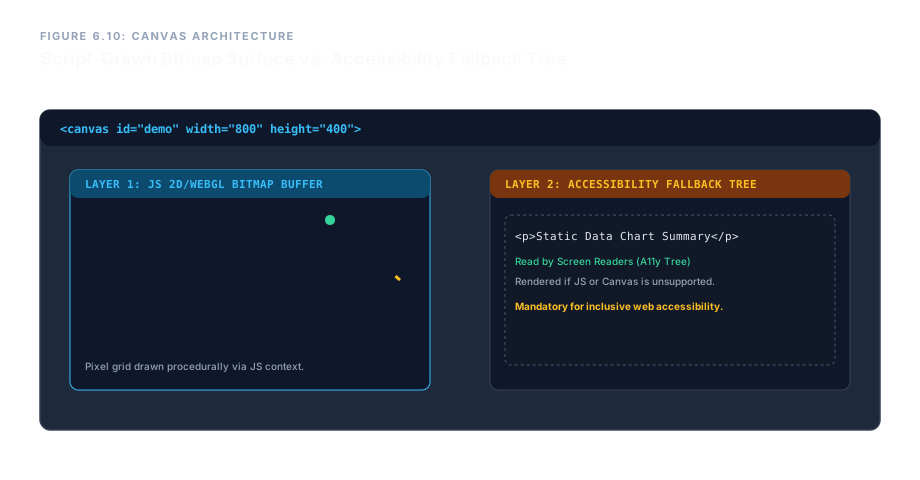
Live Example: Canvas with Fallback
<canvas id="demoCanvas" width="300" height="150">
  <p>Your browser does not support the canvas element.
     Here is a static chart instead.</p>
</canvas>A canvas element with explicit dimensions. The actual drawing requires JavaScript.
The fallback content between <canvas> and </canvas> is a safety net – it’s what screen readers and legacy browsers see.
Inline MathML, SVG, and Canvas give you direct access to mathematical notation, vector graphics, and programmable pixel surfaces without extra network requests. MathML builds semantic equation trees that assistive technology can voice. Inline SVG integrates shapes as real DOM nodes, searchable and stylable. Canvas provides a raw drawing surface but demands explicit fallback content for accessibility. Choose the right tool for the task, and your graphics will be both powerful and inclusive.